What You’ll Learn From This Report
Introduction
Get our factory farm maps for free!
Gain exclusive access to new, long-range data on the rise of factory farms and the damage they cause.
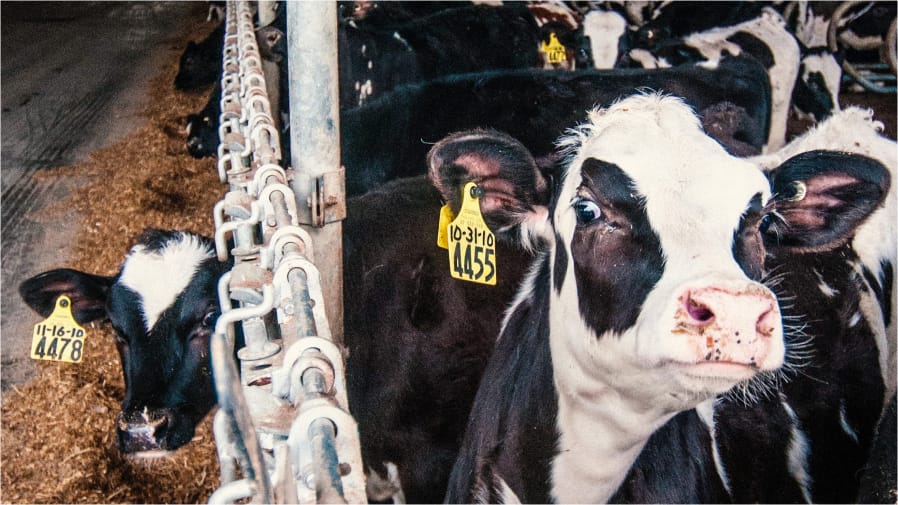
U.S. factory farms are raising more animals than ever before. Together, the 1.7 billion confined animals produce an appalling 941 billion pounds of manure each year — double the weight in human sewage produced by the entire U.S. population. This manure is typically not treated before being dumped into the environment, where it fouls rivers and streams, pollutes drinking water, and fuels climate change.
Fig. 1
Explore and click on counties in the interactive map below to see data for specific counties. Click and drag to move the map, and use the +/- control to zoom.

And it is getting worse. Food & Water Watch’s (FWW) analysis of data from the 2022 Census of Agriculture finds dramatic changes since the last Census five years earlier, including:
- Forty-nine additional counties ranking “Severe” for factory farm density (see Methodology);
- Ninety-seven million more animals living on factory farms — 6.1 percent more than five years ago, and 46.9 percent more than 20 years ago;
- Fifty-two billion additional pounds of manure generated annually, equivalent to the manure generated by nearly 39 million people (or the entire population of California); and
- Even larger factory farms as the industry continues to consolidate, with the average farm size increasing across nearly all livestock categories considered. Meanwhile, family-scale farms are collapsing, with the number of family-scale dairies falling by more than one-third from 2017 to 2022.
Big Ag’s factory farm model — which treats farms as animal warehouses, farmworkers as expendable, and the environment as a dumping ground — harms us all, and especially those living next to them. This report documents some of the most egregious damages caused by factory farm expansion, including:
- Polluted Water: U.S. counties like Washington County, Iowa are overflowing with factory farm manure that threatens clean water. In 2022, Washington County’s factory hog farms produced 4.8 billion pounds of manure — 156 times as much as the county’s human population, and more than all Iowans combined.
- Polluted Air: Maryland’s factory chicken farms in 2022 produced enough manure to fill an Olympic-sized swimming pool each day, while releasing a slew of toxic air pollutants and odors that plague nearby residents.
- Food Supply Disruptions: Factory farms are ripe breeding grounds for pathogens like bird flu, which was blamed for spikes in egg prices in 2022 and 2023. While consumers pay more, corporations can rake in record profits; Cal-Maine (the U.S.’s largest egg producer) enjoyed a five-and-a-half fold increase in net income during fiscal year 2023 compared to the previous one.
- Environmental Injustices: While rural communities see their groundwater wells run dry, California’s mega-dairies suck up 152 million gallons of water each day just to water and wash cows and buildings — more than enough water to meet the indoor water needs for the entire San Diego metropolitan area.
- Gutted Farm Income: As corporate consolidation has grown, so too have prices for ground beef, which are among the highest ever today, even when adjusting for inflation. However, farmers have seen their shares of retail beef sales fall from a high of 67.8 percent in 1973 to a low of 36.8 percent in 2021.
The evidence is clear: America’s transformation into a factory farm nation erodes rural life, guts farmer income, pollutes air and water, exploits workers, disproportionately burdens environmental justice communities, and abuses animals. Factory farms are not inevitable; they are the result of policies and incentives that favor the agribusiness corporations that have a stranglehold on our food system. The U.S. needs a fundamental change in how we produce meat, dairy, and eggs, starting with an immediate ban on new and expanding factory farms. We must also revamp state and federal policies to build a fair food system that works for everyone — not giant agribusinesses.
Factory Hog Farms Pollute Our Water and Worsen Extreme Weather Events
Fig 2.
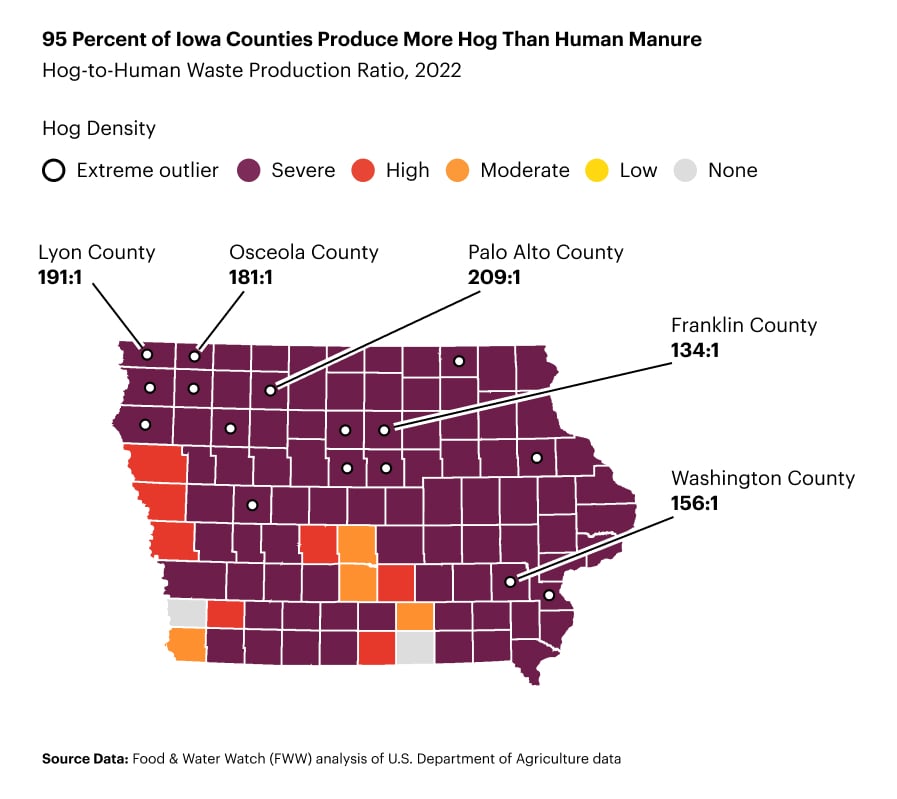
Up until the late 20th century, most hogs were raised on smaller, diversified operations. But significant changes in U.S. farm policy and growing corporate power transformed the way we grow crops and raise livestock, leading to an onslaught of factory hog operations across rural America1See Food & Water Watch (FWW). “The Economic Cost of Food Monopolies: The Hog Bosses.” May 2022., particularly in the Midwest and South. Today, the top 10 counties with the highest factory hog density are all in Iowa and North Carolina. Iowa alone confines one-third of U.S. factory-farmed hogs. Ninety-four percent of Iowa counties rank “Severe” or “High” for factory hog density (based on the number of livestock per square mile; see Methodology).
As each hog produces one-and-a-half tons of manure annually, the animals’ combined manure in a county can meet or exceed the equivalent weight in human sewage produced by entire metropolitan areas (see Fig. 3). In 2022, hogs on Washington County, Iowa factory farms produced 4.8 billion pounds of manure — 156 times as much as the county’s human population, and more than all people in Iowa combined. Unlike human sewage, hog and other livestock waste is not typically treated, and is often sprayed on farmland.2Graham, Jay P. and Keeve E. Nachman. “Managing waste from confined animal feeding operations in the United States: The need for sanitary reform.” Journal of Water and Health. Vol. 8, No. 4. December 2010 at 649 to 651 and 654.
Fig. 3
Explore our interactive map on ArcGIS Online.
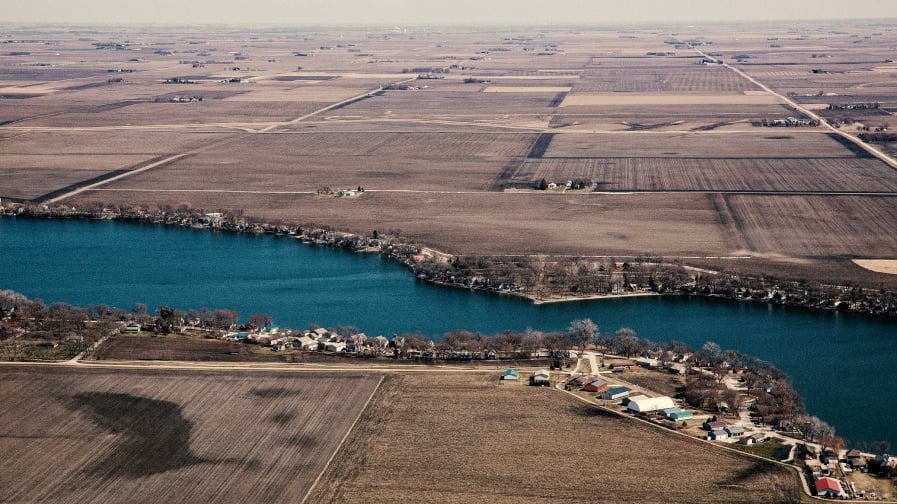
Factory hog regions in Iowa and beyond can generate more manure than can be sustainably absorbed by nearby cropland, contributing to runoff that pollutes soil and water.3Yang, Qichun et al. “Spatiotemporal patterns of livestock manure nutrient production in the conterminous United States from 1930 to 2012.” Science of the Total Environment. October 2015 at 14 to 20. In 2021, American Rivers named Iowa’s Raccoon River, which receives overflows from hundreds of factory hog operations, one of the country’s “Most Endangered Rivers.”4Jones, Chris et al. “The urgent need to address nutrient imbalance problems in Iowa’s high-density livestock regions.” Agricultural Policy Review. Fall 2019 at discussion; Food & Water Action. “American Rivers has named Iowa river ‘Most Endangered’ in the country.” April 13, 2021.
Extreme weather events — which are getting stronger and more prevalent in our changing climate5Ghazali, Daniel Aiham et al. “Climate change impacts on disaster and emergency medicine focusing on mitigation disruptive effects: An international perspective.” International Journal of Environmental Research and Public Health. Vol. 15, No. 1379. July 2018 at abstract. — contribute to major manure spills. In summer 2024, major flooding in the Midwest caused several manure lagoons to overflow into the environment.6Stanley, Greg. “Seventeen manure pits reportedly overflow at large feedlots in southern Minnesota.” Star Tribune. June 26, 2024; Jacobo, Julia. “‘Fecal soup’ could be lurking in Iowa floodwaters, health experts warn.” ABC News. June 28, 2024. In 2018, Hurricane Florence led to extensive flooding of North Carolina’s factory farms, drowning thousands of hogs and causing dozens of manure lagoons to overflow or breach entirely. Floodwaters can carry these manure pollutants downstream into flooded homes and neighborhoods, contributing to spikes in pathogens like E. coli in private drinking water wells.7Graff, Michael. “Millions of dead chickens and pigs found in hurricane floods.” Guardian. September 22, 2018; Murawski, John. “The amount of E. coli and fecal matter in NC wells has spiked since Hurricane Florence.” Raleigh News & Observer. October 24, 2018; Kasserman, Krissy. FWW. “The hog sh*t floodwater of Hurricane Florence is no accident.” September 28, 2018. Available at https://www.foodandwaterwatch.org/insight/hog-sht-floodwater-hurricane-florence-no-accident.
Contract Chicken Farming Pollutes Our Air and Abuses Farmers
Chicken farming is heavily concentrated in certain regions, including Maryland’s Eastern Shore (see Fig. 4), where communities live near factory farms housing hundreds of thousands of birds at a time. Factory chicken farms make bad neighbors, releasing foul odors that invade nearby homes and schools, even with the windows closed.8Fairchild, B. D. et al. “Ammonia concentrations downstream of broiler operations.” The Journal of Applied Poultry Research. Vol. 18, Iss. 3. Fall 2009 at 631, 634, and 636; Baykov, Bayko and Michail Stoyanov. “Microbial air pollution caused by intensive broiler chicken breeding.” FEMS Microbiology Ecology. Vol. 29. 1999 at 390 to 391; Dance, Scott. “As chicken industry booms, Eastern Shore farmers face not-in-my-backyard activism.” Baltimore Sun. April 2, 2016. The farms release a slew of toxic pollutants — including ammonia, particulate matter, and endotoxins — which irritate the respiratory system and are linked to lung disease. Industrial poultry houses also spread human pathogens and create volatile organic compounds that can harm the nervous system and contribute to toxic ground-level ozone.9Kirychuk, S. P. et al. “Total dust and endotoxin in poultry operations: Comparison between cage and floor housing and respiratory effects in workers.” Journal of Occupational and Environmental Medicine. Vol. 48, No. 7. July 2006 at 741 and 745; Trabue, Steven et al. “Speciation of volatile organic compounds from poultry production.” Agricultural and Biosystems Engineering. Vol. 44, Iss. 29. September 2010 at 3545 to 3546; U.S. Environmental Protection Agency (EPA). Office of Inspector General. “Eleven Years After Agreement, EPA Has Not Developed Reliable Emission Estimation Methods to Determine Whether Animal Feeding Operations Comply With Clean Air Act and Other Statutes.” Report No. 17-P-0396. September 2017 at 2.
Fig. 4
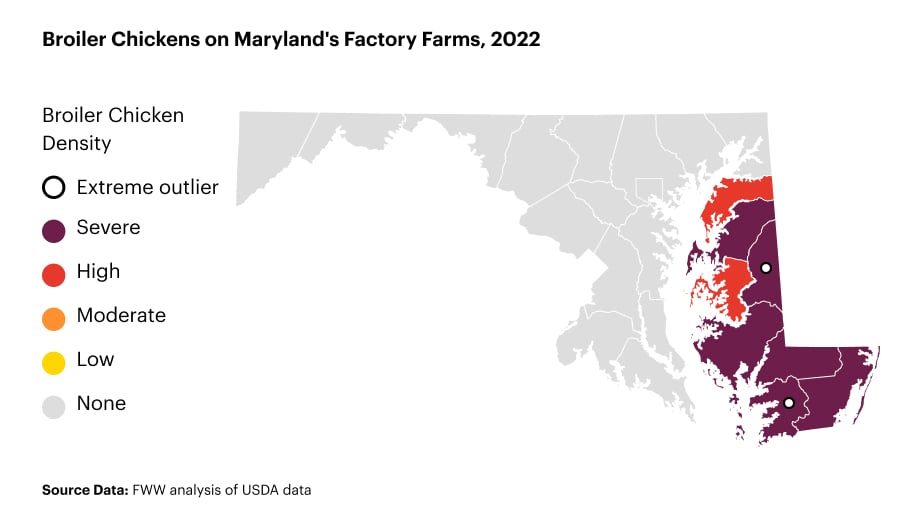
In addition, industrial poultry operations generate an enormous volume of poultry litter (a mixture of manure, feathers, and bedding).10MacDonald, James M. U.S. Department of Agriculture (USDA). Economic Research Service (ERS). “Technology, Organization, and Financial Performance in U.S. Broiler Production.” Economic Information Bulletin No. 126. June 2014 at 1 and 23. In Maryland in 2022, factory chicken farms generated an estimated 548 million pounds of poultry litter. The manure content alone was enough to fill an Olympic-sized swimming pool every day. Poultry litter is high in nitrogen and phosphorus, and overapplication on fields can contaminate groundwater, polluting drinking water sources. Elevated levels of nitrate in drinking water are linked to the life-threatening condition known as “blue baby syndrome.”11Ibid. at 23; Davis, Michael A. et al. “Poultry manure as a fertilizer.” University of Florida Extension. Reviewed January 2017; Swistock, Bryan. “Nitrates in drinking water.” PennState Extension. 2019 at 1. Additionally, agriculture is the leading human-caused source of nitrogen and phosphorus pollution in the Chesapeake Bay.12Chesapeake Bay Program. 2025 Watershed Implementation Plans (WIPs). Available at https://www.chesapeakeprogress.com/clean-water/watershed-implementation-plans. Accessed May 2024 and on file with FWW. Poultry litter contributes to this load, impeding efforts to restore this important estuary.13Amato, Heather K. et al. “Effects of concentrated poultry operations and cropland manure application on antibiotic resistant Escherichia coli and nutrient pollution in Chesapeake Bay watersheds.” Science of the Total Environment. Vol. 735. September 2020 at abstract.
The extreme concentration of factory farms in a region is all part of the poultry industry’s business model. Ninety-six percent of broiler chickens sold in the U.S. are raised under production contracts.14FWW analysis of USDA. National Agricultural Statistics Service (NASS). Quick Stats. Available at https://quickstats.nass.usda.gov. Accessed May 2024. In these systems, growers do not own the birds but instead raise them under contract with agribusinesses like Perdue and Tysons (the integrators), which lower costs by contracting with multiple growers in the same region.15MacDonald (2014) at 1; Key, Nigel and James M. MacDonald. USDA ERS. “Local Monopsony Power in the Market for Broilers? Evidence From a Farm Survey.” Selected Paper at the Annual Meeting of the Agricultural & Applied Economics Association. Orlando, FL. July 27-29, 2008 at 3. Agribusinesses shift many of the risks involved in raising chickens (as well as the burden of litter disposal) onto the shoulders of growers.16MacDonald (2014) at 23, 26 to 27, and 31; Moodie, Alison. “Fowl play: The chicken farmers being bullied by big poultry.” Guardian. April 22, 2017. Integrators are able to offer such one-sided contracts in part because of extreme market consolidation, with limited numbers of integrators working with growers. Walking away is not necessarily an option when growers accrue massive debt to keep up with contract requirements.17Key and MacDonald (2008) at 3 to 4 and 7; Moodie (2017).
Take a stand against factory farms.
The Biden administration is targeting abusive poultry contracts as part of its efforts to strengthen protections under the Packers and Stockyards Act, initially enacted over 100 years ago to protect farmers and consumers from unfair and deceptive practices by the livestock industry.18National Farmers Union (NFU). [Fact sheet]. “Packers and Stockyards Act.” Updated May 2024; USDA. [Press release]. “USDA proposes next steps to promote fairer poultry markets, protect producers, and enhance transparency.” June 3, 2024. A rule proposed by the U.S. Department of Agriculture (USDA) in June 2024 would regulate “tournament” systems. These pit farmers against each other, rewarding some and punishing others based on how efficiently their chickens gain weight, which can be largely outside of farmers’ control.19Kelloway, Claire. “USDA proposes to regulate chicken tournament systems.” Food & Power. June 14, 2024. A stronger rule would ban such tournament systems outright. Ultimately, the USDA must prioritize providing resources for chicken farmers to break out of the contract system altogether and to raise and market their animals or crops on independent, sustainable farms.
Peeling back industry myths on factory farms and rural livelihoods
The factory farm industry likes to claim that its industrial model supports rural communities and creates jobs, and to stoke fears about job losses when opposing rules and legislation that challenge corporate power.20National Pork Producers Council (NPPC). “Pork facts.” Available at https://nppc.org/pork-facts. Accessed November 2021 and on file with FWW; NPPC. [Press release]. “New economic impact study on livestock rule means rural job losses & higher meat prices.” October 21, 2010. If this were the case, rural Iowa — ground zero for U.S. hog production — should be brimming with wealth and prosperity. Instead, Iowa serves as a tragic case study in the social and economic harms associated with factory farm expansion.
In 2022, the average Iowa hog farm sold 11,642 hogs — a 24-fold increase from 1982 (486 hogs). Over the same time, the state lost nearly 90 percent of its hog farms (see Fig. 5.). A FWW analysis explored how fewer farms and ever-larger operations that contract with agribusinesses shift the economic power within farm communities.21See Food & Water Watch. “The Economic Cost of Food Monopolies: The Hog Bosses.” May 2022. We found that the Iowa counties that sold the most hogs and had the largest operations experienced declines in real median income and population from 1982 to 2017, as well as losses in wage jobs and local businesses that exceeded the state average. In fact, Iowa had over 40 percent fewer farm jobs in 2017 compared with 1982, with even greater declines in counties with the most hogs sold and the largest hog farms — despite the state collectively selling 2.5 times as many hogs.
Fig. 5
The economic gains from overproduction of hogs on factory farms appear to concentrate wealth among the largest factory farms, which in turn tend to make fewer local purchases and hire fewer workers per hog sold than their smaller counterparts, creating cascading effects across the entire county. This hypothesis is supported by a growing body of research linking factory farm growth with declines in the economic and social well-being of communities, including higher levels of poverty and economic inequality, increased use of supplemental nutrition assistance, and outmigration.22Lobao, Linda and Curtis W. Stofferahn. “The community effects of industrialized farming: Social science research and challenges to corporate farming laws.” Agriculture and Human Values. Vol. 25, Iss. 2. June 2008 at 220 to 221 and 225; Durrenberger, E. Paul and Kendall M. Thu. “The expansion of large scale hog farming in Iowa: The applicability of Goldschmidt’s findings fifty years later.” Human Organization. Vol. 55, No. 4. Winter 1996 at 411 to 412; Lyson, Thomas A. and Rick Welsh. “Agricultural industrialization, anticorporate farming laws, and rural community welfare.” Environment and Planning A: Economy and Space. Vol. 37, Iss. 8. August 1, 2005 at 1487 to 1488.
Simply put, the factory farm model is anti-farm and anti-farmer, and instead is just another means for agribusiness giants to extract wealth from rural America.
Factory Egg Farms Contribute to Supply Chain Vulnerability and Threaten Worker Health
Nationally, the total number of egg-producing factory farms fell by one-third between 2002 and 2022, while the total hens on these operations increased, as factory farms got larger (see Fig. 6). The average egg-laying factory farm in 2022 confined over 800,000 hens, but facilities in top egg-producing states can confine a million or more. In May 2024, an outbreak of bird flu in a single Iowa factory farm led to the killing of the facility’s 4.2 million hens.23“Farmers must kill 4.2 million chickens after bird flu hits Iowa egg farm.” Associated Press. Updated May 28, 2024. Factory farms are incubators for zoonotic diseases and have been linked to the spread of human pandemics like the avian and swine flu outbreaks of the early 2000s.24Marchese, Alyssa and Alice Hovorka. “Zoonoses transfer, factory farms and unsustainable human-animal relations.” Sustainability. 2022 at 2 to 4.
Fig. 6
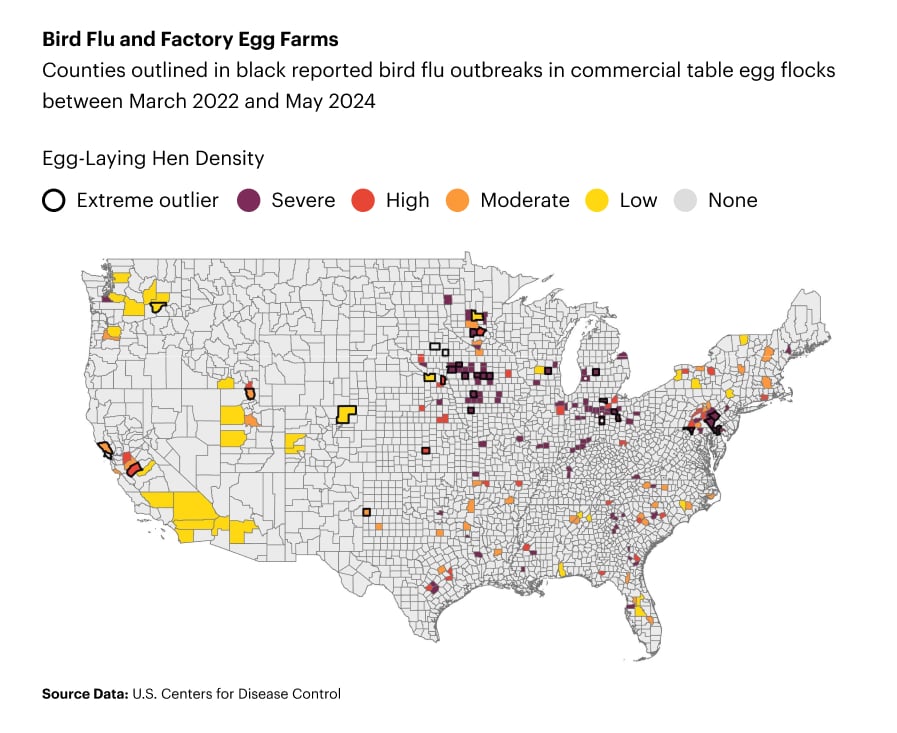
The sheer magnitude of factory egg farms makes a single outbreak of bird flu all the more impactful, as does our highly consolidated food system, which is vulnerable to supply shocks and disruptions.25Kelloway, Claire. “As bird flu hits dairy cows, consolidation amplifies risk.” Food & Power. April 18, 2024; U.S. Federal Trade Commission (FTC). “Feeding America in a Time of Crisis: The United States Grocery Supply Chain and the COVID-19 Pandemic.” March 2024 at 2. Average egg prices spiked to nearly $5 a dozen in January 2023, compared to under $2 a dozen one year earlier.26U.S. Department of Labor (DOL). Bureau of Labor Statistics (BLS). BLS Data Viewer. Available at https://data.bls.gov/timeseries/APU0000708111. Accessed June 2024. Cal-Maine, the U.S.’s largest egg producer, blamed bird flu disruptions for charging wholesalers such high egg prices — while raking in a five-and-a-half-fold increase in net income in fiscal year 2023 over 2022. Cal-Maine in fact sold more eggs and did not experience an outbreak in its flocks during fiscal year 2023.27Cal-Maine Foods, Inc. U.S. Securities and Exchange Commission (SEC). Form 10-K. Commission File No. 001-38695. FY ended June 3, 2023 at 3 to 5 and 23 to 24. A Federal Trade Commission report slammed grocery chains for similar profiteering during COVID-19 related shortages.28FTC (2024) at 2.
Workers, meanwhile, risk exposure to bird flu, one of many workplace hazards inherent in factory farms, where conditions can be a nightmare. Long-term exposure to toxic poultry dust is linked to a slew of respiratory problems including chronic phlegm, asthma, and chronic bronchitis.29Kirychuk et al. (2006) at 741 and 744 to 745; Viegas, S. et al. “Occupational exposure to poultry dust and effects on the respiratory system in workers.” Journal of Toxicology and Environmental Health, Part A. Vol. 76. 2013 at 230 to 231. Injuries are another workplace hazard. The animal production industry as a whole (which includes workers raising animals on farms and feedlots) has an alarmingly high rate of non-fatal workplace injuries — the 2022 rate was 3.5 times that of the oil and gas extraction industry.30FWW analysis of DOL BLS. Industries at a Glance. Animal Production: NAICS 112. Available at https://www.bls.gov/iag/tgs/iag112.htm, and Oil and Gas Extraction: NAICS 211, available at https://www.bls.gov/iag/tgs/iag21.htm. Accessed May 2024. These figures only include reported incidents; workers may be reluctant to report injuries, especially undocumented immigrants, who often undertake the most dangerous jobs on factory farms.31U.S. Government Accountability Office (GAO). “Workplace Safety and Health: Additional Data Needed to Address Continued Hazards in the Meat and Poultry Industry.” GAO-16-337. April 2016 at 47; Perez, Maria. “Wisconsin’s dairy industry would collapse without the work of Latino immigrants — many of them undocumented.” Milwaukee Journal Sentinel. November 21, 2019.
Bird flu is just one threat to hens on factory farms, where animal welfare takes a back seat to industry profits.32Cassuto, David N. and Cayleigh Eckhardt. “Don’t be cruel (anymore): A look at the animal cruelty regimes of the United States and Brazil with a call for a new Animal Welfare Agency.” Boston College Environmental Affairs Law Review. Vol. 43, Iss. 1. February 2016 at 6 to 7. State legislation and commitments from retailers have increased the availability of cage-free eggs33USDA ERS. “Growing share of egg-laying hens are cage-free.” Updated October 11, 2023. Available at https://www.ers.usda.gov/data-products/chart-gallery/gallery/chart-detail/?chartId=107564., yet the USDA’s weak labeling requirements mean that a “cage-free” hen can still spend her entire life confined inside a crowded building.34FWW. “How Much Do Food Labels Tell You?” June 2021 at 1 to 2. The majority of U.S. egg-laying hens are still locked in cages, with as little as a piece of printing paper’s worth of space per hen.35USDA ERS (October 2023); Mandoli, Ava. “Graphic: More than 75% of egg-laying hens live in states with little-to-no welfare protections.” Investigate Midwest. June 27, 2023. Industry practices like “debeaking” (done without anesthesia) cause lasting pain and stress.36Cassuto and Eckhardt (2016) at 6 to 7 and 25 to 26; MacDonald, James. USDA ERS. “CAFOs: Farm animals and industrialized livestock production.” Oxford Research Encyclopedia. July 2018 at 14. Unsurprisingly, agribusinesses are largely resistant to any proposals to improve welfare conditions for workers and animals, and some even fight to preempt state regulations that provide modest improvements.37Fortune, Aiden. “US meat industry sues California over welfare legislation.” Global Meat News. October 9, 2019; Erwin, Nicole. “Too fast for safety? Poultry industry wants to speed up the slaughter line.” NPR. October 27, 2017. We cannot wait for industry to choose health and safety over profits; reform must come from revamping our federal agricultural policies that uphold the factory farm system.
Mega-Dairies Fuel Environmental Injustice and Climate Change
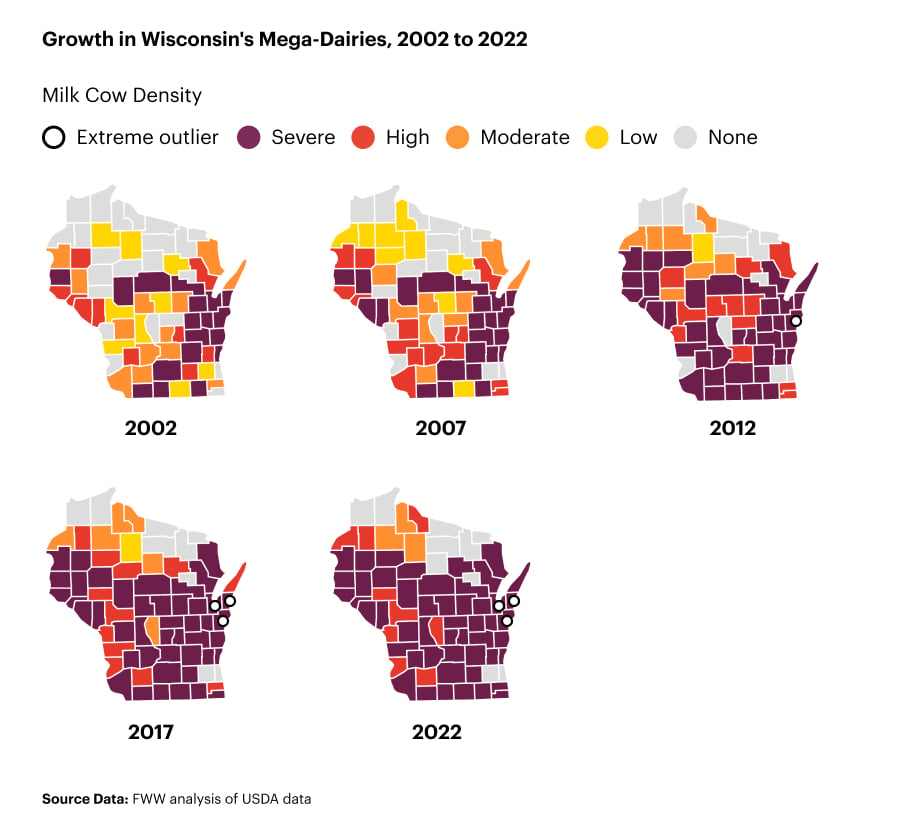
Nowhere is the shift from family-scale to factory operations more apparent than in the dairy industry, where consolidation occurred at a faster pace than in almost every other agricultural sector — a 16-fold increase in consolidation over just 30 years (1987 to 2017).38MacDonald, James M. et al. USDA ERS. “Consolidation in U.S. Dairy Farming.” Economic Research Report No. 274. July 2020 at 11. Wisconsin, for example, saw the number of cows living on factory farms (also called mega-dairies) more than quadruple in just 20 years (2002 to 2022) (see Fig. 7). At the same time, the U.S. is bleeding family-scale dairies. California, for instance, reported roughly half as many family-scale dairies in 2022 compared to just 2017, while the average number of milk cows per mega-dairy ballooned to 2,300. California now houses more milk cows on mega-dairies than any other state — twice that of Wisconsin, which ranks second.
Fig. 7
Factory farms have long been disproportionately located in low-income and non-white areas.39Gittelson, Phoebe et al. “The false promise of biogas: Why biogas is an environmental justice issue.” Environmental Justice. Vol. 15, No. 6. 2022 at 356. For example, California’s San Joaquin Valley — which houses 90 percent of the state’s dairy cows — has a higher ratio of Latinx residents compared to California as a whole. Mega-dairies and other factory farms contribute over half of the region’s emissions of ammonia, a toxic gas that causes respiratory issues. Ammonia reacts with nitrogen oxides (NOx) (another mega-dairy pollutant) to form particulate matter, which is responsible for over 1,000 premature deaths annually in the San Joaquin Valley.40Katz, Jamie et al. “Leadership Council for Justice and Accountability, Central Valley Defenders for Clean Water & Air, Animal Legal Defense Fund, and Food & Water Watch Comments on Proposed Amendments to the Low Carbon Fuel Standard.” Submitted to the California Air Resources Board (CARB). February 20, 2023 at 2 to 4. Available at https://www.arb.ca.gov/lispub/comm/iframe_bccomdisp.php?listname=lcfs2024&comment_num=7060&virt_num=. In addition to these health hazards, residents near mega-dairies and other factory farms report foul odors and flies that keep them from enjoying the outdoors or even opening their windows.41Ibid. at 7; Weida, William J. The Colorado College. “A synopsis of potential impacts from dairies on a regional economy.” March 2003 at 1 to 2; Border 2012 Texas-New Mexico-Chihuahua Regional Work Group Public Meeting. Minutes. Anthony, New Mexico. November 4, 2010 at 2 to 3.
Mega-dairies compete for water resources at a time when thousands of California’s domestic water wells are running dry, and over a million Californians do not have access to safe drinking water.42FWW. “Fighting for the Human Right to Water in Tombstone Territory, California.” March 2023 at introduction. FWW estimates that California’s mega-dairies require 152 million gallons of water each day just to water and wash cows and buildings. This is more than enough to meet the indoor water needs for the entire San Diego metropolitan area. This does not include the water needed to move manure into storage systems, or to produce animal feed, which encompasses the largest water footprint for milk production.
Mega-dairy pollutants also help fuel the climate crisis. Annual methane emissions from dairy manure management in the U.S. more than doubled between 1990 and 2022 despite overall dairy herd numbers staying relatively steady — thanks to mega-dairy practices like liquid manure storage that release significantly more methane than pasture-based systems.43EPA. “Inventory of U.S. Greenhouse Gas Emissions and Sinks, 1990-2022.” EPA 430-R-24-004. April 2024 at 5-11, 5-13, table 5-6, and A-320, table A-155. Additionally, larger farms are less likely to graze their cattle on pasture and instead rely on purchased feed, which is the single largest source of livestock industry greenhouse gas emissions.44MacDonald (2020) at 13, table 2 and 21; Gerber, P. J. et al. (2013). Tackling Climate Change Through Livestock: A Global Assessment of Emissions and Mitigation Opportunities. Rome: Food and Agriculture Organization of the United Nations (FAO) at xii.
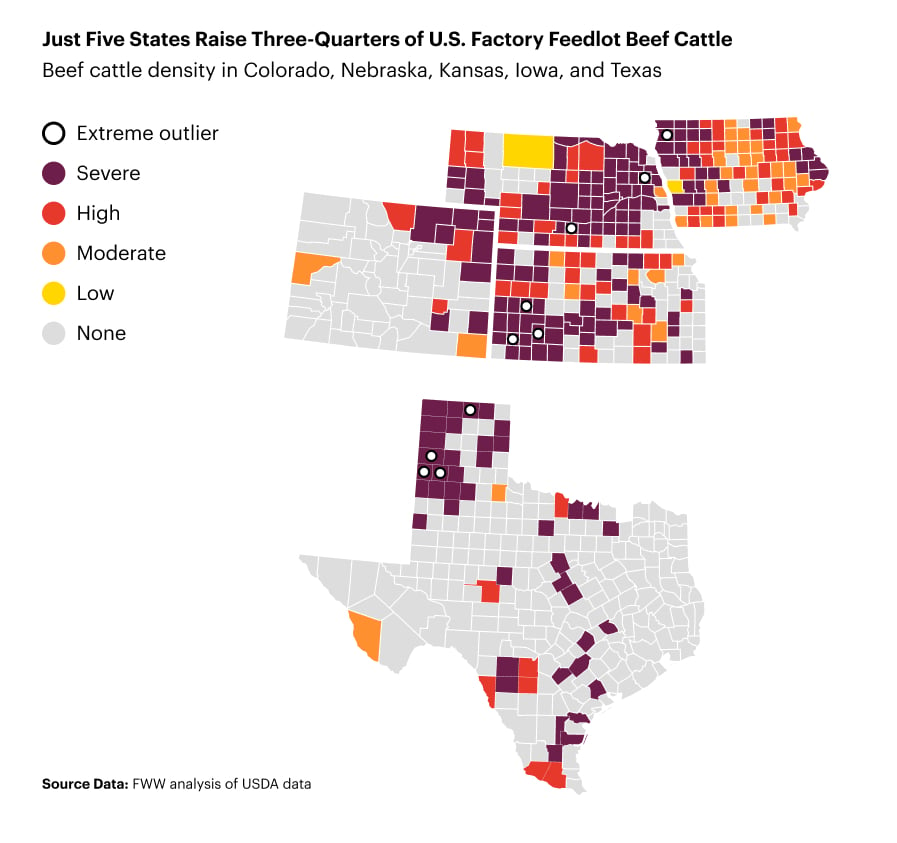
Mega-Feedlots Gut Farmer Profits and Raise Food Prices
U.S. beef cattle begin their lives on cow-calf operations — mainly on farms with fewer than 50 cows — before being sold to feedlots for “finishing.”45USDA ERS. “Smaller cow-calf operations still outnumber large operations, but herd sizes have increased.” Updated August 17, 2023. Available at https://www.ers.usda.gov/data-products/chart-gallery/gallery/chart-detail/?chartId=107125. Until the mid-1960s, the majority of beef cattle were finished on small “farmer-feedlots” where farmers raised their own feed.46MacDonald, James M. and William D. McBride. USDA ERS. “The Transformation of U.S. Livestock Agriculture: Scale, Efficiency, and Risks.” Economic Information Bulletin No. 43. January 2009 at 12. Today, however, mega-feedlots dominate the market, with just five states accounting for three-quarters of all factory feedlot cattle. The average factory feedlot houses around 4,500 head of cattle, a figure that obscures the true extent of the problem. The USDA reports that half of U.S. beef cattle are finished on just 132 feedlots, each with a capacity of at least 32,000 head.47MacDonald, James M. et al. USDA ERS. “Concentration and Competition in U.S. Agribusiness.” Economic Information Bulletin No. 256. June 2023 at 27. A feedlot of this size produces as much manure as a city of half a million people.
Fig. 8
As feedlot size expanded, so too did the meat-packing industry’s stranglehold on the market. In 1980, the top four beef-packing firms slaughtered one out of three beef cattle; this increased to four out of five by 1995 and remains steady to this day. Local markets can be even more consolidated, leaving farmers with their hands tied, as transporting livestock between the feedlot and the slaughterhouse is expensive, limiting farmers’ ability to seek other buyers. This extreme consolidation can enable meatpackers to exercise greater control over livestock prices.48 Ibid. at 25 and 28 to 36; Kelloway, Claire and Sarah Miller. Open Markets Institute. “Food and Power: Addressing Monopolization in America’s Food System.” Updated September 2021 at 3. Unfortunately, federal regulations enacted over 100 years ago to protect farmers and ranchers in a highly consolidated market did not prevent further consolidation or these abusive practices.49Kelloway and Miller (2021) at 12; NFU (2024). The Biden administration’s efforts to strengthen these protections under the Packers & Stockyards Act50NFU (2024); USDA (2024). are a necessary first step toward protecting farmers, but they are not enough; we need to enforce antitrust law and break up the meat conglomerates.
We can see this power dynamic play out in the farm-to-consumer “price spread” — the difference between what farmers earn and what consumers pay at the grocery store. This gap has widened in recent decades, corresponding with the rapid consolidation across the meatpacking and grocery retail industries.51FWW. “The Economic Cost of Food Monopolies: The Grocery Cartels.” November 2021 at 2 to 4. Inflation-adjusted retail prices for ground beef today are among the highest ever recorded, averaging over $5 per pound in the first four months of 2024 (see Fig. 9). Meanwhile, the farmers’ share of the retail value fell from a high of 60 percent in 1984 to a low of 37 percent in 2021. Consumers and farmers are getting fleeced, while giant meatpackers and supermarkets rake in record profits.52Ibid.; Kelloway and Miller (2021) at 3.
We Must Fight Corporate Power to End Factory Farms
Decades of failure to uphold our nation’s antitrust laws have enabled a handful of multi-national corporations to dominate every step along the food supply chain and to amass significant wealth. In turn, these powerful corporations collectively pour millions of dollars into lobbying elected officials on the Farm Bill and other policies that keep the factory farm status quo. Today, U.S. farm policy continues to incentivize the overproduction of commodities like corn and soybeans, providing artificially cheap feed for factory farms; meanwhile, public funding is flowing to factory farm projects like anaerobic digesters.53FWW. “A Fair Farm Bill for All.” January 2023 at 3 to 6. Moreover, polluting factory farms continue to evade regulation under our nation’s premier environmental laws such as the Clean Water Act and the Clean Air Act.54Miller, Emily. FWW. Letter to Administrator Michael Regan. EPA. “Re: Petition to Rescind the Air Consent Agreement and Enforce Clean Air Laws Against Animal Feeding Operations.” April 5, 2023 at 1 to 5. Available at https://www.foodandwaterwatch.org/wp-content/uploads/2023/04/2023.4.5-EPA-Letter.pdf; Miller, Emily. FWW. “We’ve Sued EPA to Strengthen Clean Water Rules for Factory Farms.” February 26, 2024. Available at https://www.foodandwaterwatch.org/2024/02/26/weve-sued-epa-to-strengthen-clean-water-rules-for-factory-farms.
The problem is bigger than any individual can solve alone. We need to elect leaders who are brave enough to fight back against corporate power, as well as to hold our elected leaders accountable when they do Big Ag’s bidding. And we need to organize and educate within our own communities on the countless harms of factory farms and the need for new farm policies that work for people and animals — not corporations.
To create a just and sustainable food system, our elected officials must prioritize:
- An immediate, national ban on new factory farms and on the expansion of existing ones, with research and funding to help current factory farm operators transition to smaller, more sustainable crop and/or livestock systems;
- Investment to expand local and regional food markets and to build the infrastructure needed to help farmers bring their products to market;
- Reestablishing supply management controls, including the national grain reserve and price floors;
- Expanding crop insurance and other subsidies to cover more crops that directly feed people;
- Closing loopholes — like guaranteed loans and conservation payments — that allow factory farms to hijack public funds;
- Enforcing Clean Water Act and Clean Air Act regulations with respect to livestock operations;
- Enforcing antitrust legislation with respect to agribusinesses; and
- Rejecting false solutions like factory farm gas (greenwashed as biogas).
Ending factory farms will shift our food economy to embrace more regional, diverse food choices. Consumers who choose to eat meat can embrace a “less-is-better” approach, choosing high-quality meat, dairy, and eggs from local producers — a win-win-win for consumers, farmers, and the planet. However, we cannot shop our way out of this problem. We need to vote for candidates who share this vision of a more just and sustainable food system — and who are willing to take on the agribusiness giants that are only out to promote their corporate interests.
Take a stand against factory farms.
Methodology
Data collection
Food & Water Watch (FWW) compiled data from the five most recent U.S. Department of Agriculture (USDA) Census of Agriculture reports (2002, 2007, 2012, 2017, and 2022), a comprehensive survey that includes data on livestock inventory, number and size of operations, and livestock sales, among many others, down to the county level.
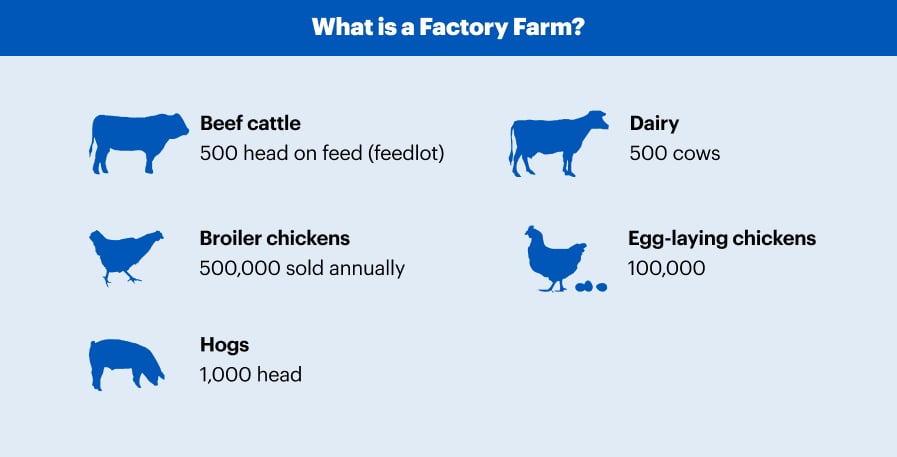
We classified operations as “factory farms” if they met the following Census categories: 500 or more beef cattle on feed, 500 or more milk cows, 1,000 or more hogs, 500,000 or more broiler (meat) chickens sold annually, and 100,000 or more egg-laying hens. (For the broiler category, we first divided the county sales in the given year by 5.5 — the approximate number of flocks raised annually per operation — to get an estimated inventory at any given time.55Rhodes, Jennifer L. et al. University of Maryland Extension. “Broiler Production Management for Potential and Existing Growers.” Updated 2011 at 13.) These categories roughly align with the U.S. Environmental Protection Agency’s size criteria for medium-sized concentrated animal feeding operations (CAFOs).5640 CFR § 122.23. In this report, “family-scale” farms refer to operations with inventories smaller than these benchmarks.
The USDA does not report county-level inventory and sales data for broilers and layers by farm size. Instead, we first used state-level data to calculate the average inventories and sales per factory farm. We then applied the state average to each operation within a state’s counties before calculating its county-level inventories. Similarly, we applied state-wide averages in instances where the USDA withheld inventory figures for factory operations within a given county (in order to protect the identities of operations in counties where few exist).57See USDA NASS. “2017 Census of Agriculture: U.S. Summary and State Data.” AC-17-A-51. April 2019 at IX.
For the “All Livestock” category, we first converted inventory data into animal units, a weight-based measurement that is used to aggregate livestock inventories across various animal types. Animal unit measurements vary slightly among different state and federal agencies. For this report, we use the USDA’s definition of one animal unit equaling 1,000 pounds of live weight, which amounts to 1.14 feedlot beef cows, 0.74 dairy cows, 9.09 hogs for slaughter, 455 broiler chickens, and 250 laying hens.58Gollehon, Noel et al. USDA ERS. “Confined Animal Production and Manure Nutrients.” AIB-771. June 2001 at 8, table 1.
NOTE: Alaskan counties are reported together in groups, but none reported factory farms for the livestock categories and years covered in this report. Kalawao County is included in Maui County, Hawaii, which reported only one factory farm over this report’s time frame (a hog farm of undisclosed size in 2002).
Density Rankings
In previous factory farm map releases, we used county-level inventories of factory-farmed animals as the basis for our density rankings. We updated the methodology to account for the size differences between U.S. counties, first dividing livestock inventories by county area to arrive at the average animals per square mile (livestock density) and rounding these figures to 3 decimal places. We calculated the quartile distribution of county livestock densities greater than zero for each livestock category in 2002, assigning counties with ranks from “Low” to “Extreme,” and assigning counties with no livestock on factory farms “None.” We used the 2002 quartiles as the basis for subsequent Census year rankings to highlight the growth of factory farms over time. We gave any counties and county-equivalent areas not reported individually in the Census59Alaskan counties are reported together in groups, but none reported factory farms for the livestock categories and years covered in this report. Kalawao County is included in Maui County, Hawaii, which reported only one factory farm over this report’s time frame (a hog farm of undisclosed size in 2002). a default ranking of “None” (see Fig. 10).
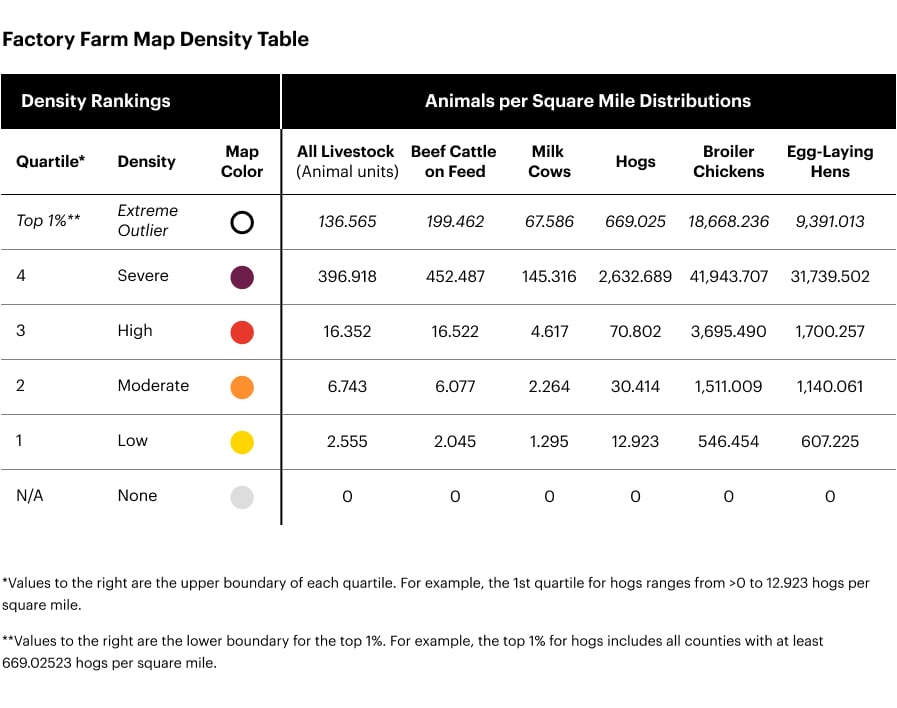
Quartile distributions often do not account for significant outliers. For example, the fourth (“Severe”) quartile for hogs on factory farms includes those counties with livestock densities of 70.8 hogs per square mile or more; however, a handful of counties in Iowa, North Carolina, and Minnesota exceed 1,000 hogs per square mile. To highlight these regions of severe factory livestock density, we calculated the top 1 percent of counties by livestock density for each category in 2002, and kept these same benchmarks across subsequent Census years to highlight worsening concentration. We displayed these as points on our maps (see below).
Mapping
We built the maps in ArcGIS Pro, using feature layers from ArcGIS’s Living Atlas of the World to display U.S. counties60“USA Census Counties.” Available at https://www.arcgis.com/home/item.html?id=14c5450526a8430298b2fa74da12c2f4. Accessed May 2024. and state boundaries.61“US State Internal Boundaries.” Available at https://www.arcgis.com/home/item.html?id=ab5cc7ae9fab45bd880af8e1e8b7dc7c. Accessed May 2024. We joined the county feature layer to tables that included our density rankings. We then displayed county density codes by assigning a unique color to each ranking category. We added a point layer indicating the county “outliers,” or those that would qualify as in the top 1 percent based on the 2002 Census distribution. We then shared these maps on ArcGIS Online and edited the styles for usability.
Manure production and human sewage equivalencies
FWW previously relied on estimates for livestock and human manure production from a 2004 EPA factory farm risk assessment.62EPA. “Risk Assessment Evaluation for Concentrated Animal Feeding Operations.” EPA/600/R-04/042. May 2004 at table 3.3 at 9. Beginning with the 2020 map release, we updated our calculations on livestock manure production using the most recent agency estimates we could find — specifically, a 2013 EPA report that employed USDA methodologies.63EPA. “Literature Review of Contaminants in Livestock and Poultry Manure and Implications for Water Quality.” EPA 820-R-13-002. July 2013 at 109. The estimates for livestock manure production by weight were nearly identical to those in the 2004 EPA assessment, and were used when estimating the total weight or volume of manure produced by all five livestock categories.
When considering broilers alone, we calculated litter production (the combination of manure, feathers, and bedding from chicken houses) using estimates developed for the Chesapeake Bay Foundation.64Chesapeake Bay Program. Agricultural Modeling Subcommittee. “Recommendations to Estimate Poultry Nutrient Production in the Phase 6 Watershed Model.” March 2015 at 6. As this methodology relates only to broiler (meat) chickens, we did not apply it to egg-laying hens.
Beginning with the 2020 report release, FWW stopped using the 2004 EPA assessment to estimate human manure production, as this considers only fecal matter, whereas the EPA’s livestock estimates include both urine and feces, creating an insufficient comparison.65EPA (2004) at 9 and 63. Instead, we used the most recent estimate of human manure (urine and feces) production we could find referenced in an agency document, a 2008 Government Accountability Office report.66GAO. “Concentrated Animal Feeding Operations: EPA Needs More Information and a Clearly Defined Strategy to Protect Air and Water Quality From Pollutants of Concern.” GAO-08-944. September 2008 at 58. This lowered the livestock-to-human waste ratios from previous map iterations and reports. We continued to use the U.S. Census Bureau’s American Community Survey 5-year estimates in comparisons of county-level livestock waste production to human populations of counties and major metropolitan areas.
Water use by mega-dairies
FWW used variables from Mekonnen and Hoekstra (2012)67Mekonnen, Mesfin M. and Arjen Y. Hoekstra. University of Twente. “A global assessment of the water footprint of farm animals.” Ecosystems. Vol. 15. 2012. to estimate the total lifecycle water use needed to produce milk at industrial-scale dairies in the U.S. (This estimate does not include water used to flush manure into storage systems.) Feed production encompasses the most significant water footprint for animal products (98 percent), but as feed may be imported from off the farm, we focused on the immediate water use of mega-dairies like watering cows and washing facilities.68Ibid. at 402 to 403 and 408. We compared these figures to the State of California’s target of 42 gallons per person per day for residential indoor water needs.69California Water Code § 10609.4(a)(3) (2022).
Endnotes